Stock Analysis Tool
I built a small stock-analysis web application as part of teaching myself more about software engineering.
The basic idea was to collect historical financial-statement data for public companies, store it in a database, calculate a few useful ratios, and provide a web interface for searching, visualising, and filtering the results.
It was not an attempt to build a professional investment platform. It was a way to work through an end-to-end project involving data collection, database design, backend code, and a browser-based interface.
Collecting Financial Data
The project began with a website that published company financial statements.
I wrote a Python scraper using Beautiful Soup to collect the data. The scraper would extract figures from financial statements and turn them into structured records that could be loaded into a database. The site tried to block scrapers, so I had to change my user agent every now and then and connect to the site via Tor.
That meant dealing with the usual awkward parts of web-scraped data:
- Company names, ticker symbols, and exchanges
- Financial-statement values spread across multiple reporting periods
- Different statement sections, including income statements, balance sheets, cash-flow data, and per-share figures
- Missing values and fields that were not always presented consistently
Once it was in a database, the data became much easier to query than a collection of pages or downloaded tables
Browsing a Company
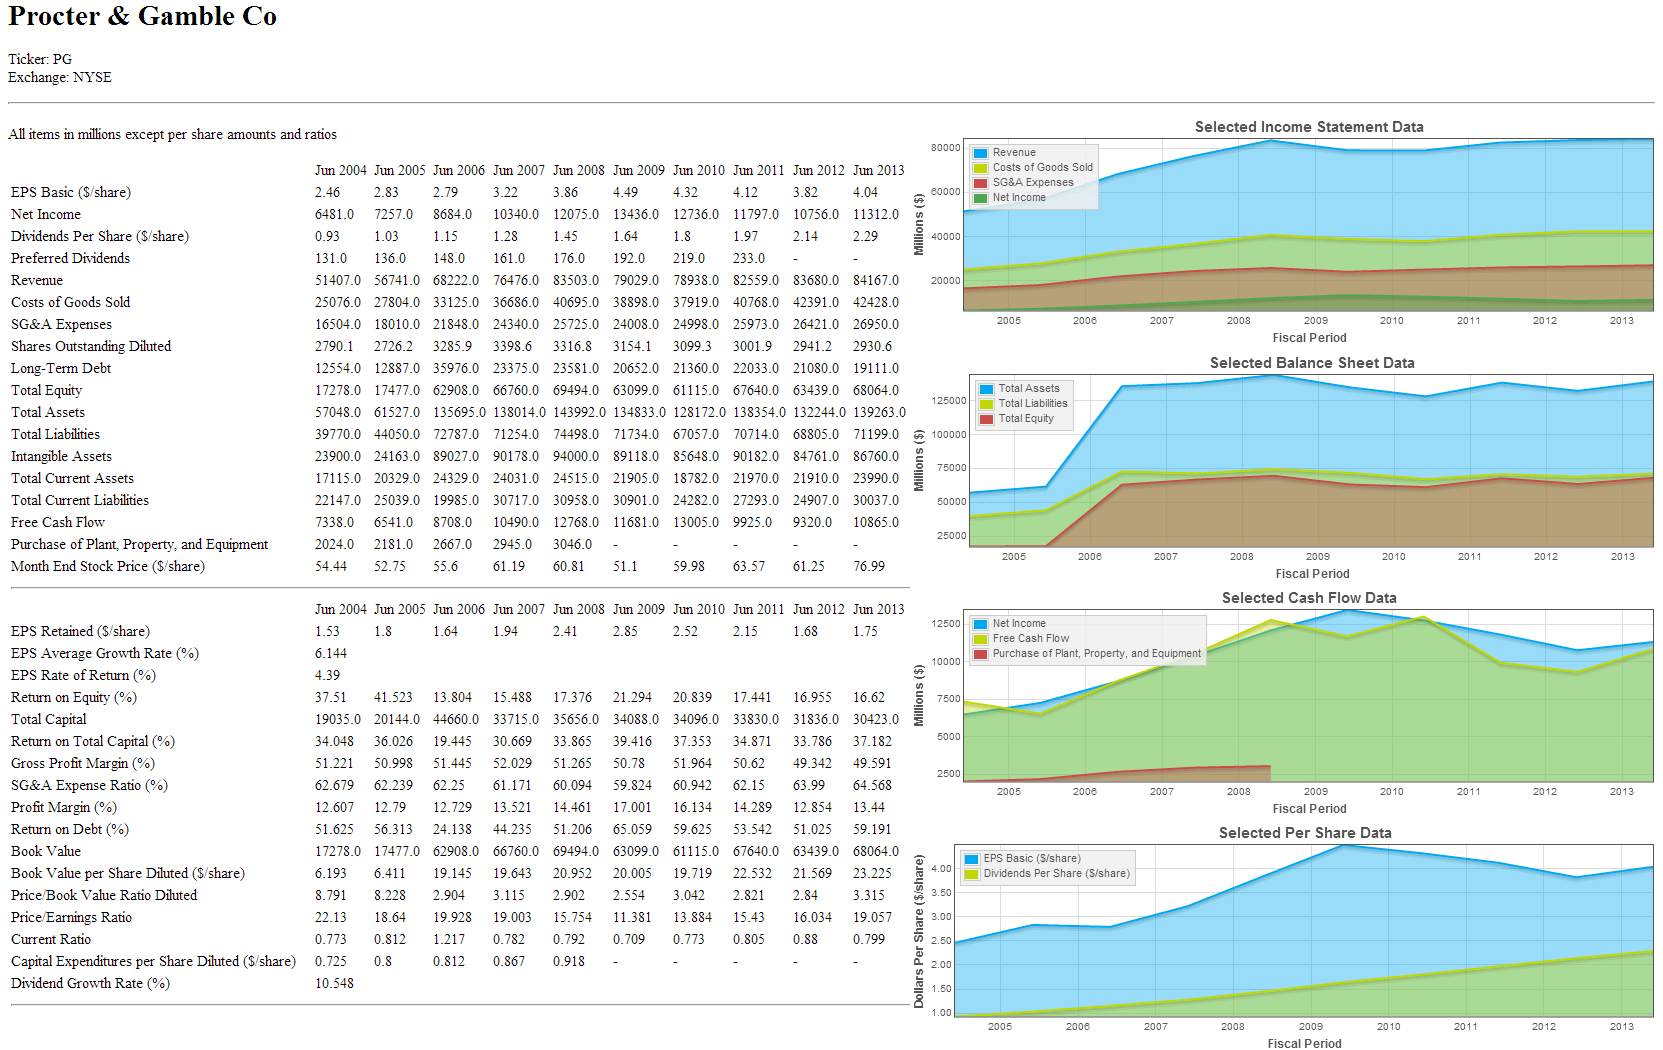
The company page brought the statement data together in one place
A user could search for a ticker, open a company, and see historical figures across several years.
The page included values such as revenue, net income, assets, liabilities, free cash flow, earnings per share, dividends, and debt.
It also calculated derived metrics from the raw data, including examples such as:
- Return on equity.
- Return on total capital.
- Gross and profit margins.
- Current ratio.
- Price-to-earnings and price-to-book ratios.
- Dividend growth.
The point was not to declare whether a company was a good investment. It was to make the underlying numbers and a few common comparisons easier to inspect.
Adding Charts
Tables are useful, but they make long-term trends difficult to see at a glance.
I added charts for selected groups of data, including income-statement, balance-sheet, cash-flow, and per-share figures. For example, revenue, cost of goods sold, SG&A expense, and net income could be compared across years rather than read one cell at a time.
The charts were a simple but useful addition. A company can report growing revenue while margins or cash flow move in a less encouraging direction; a visual trend makes those relationships easier to notice.
Searching and Screening
The application also included a company search page and a stock screener.
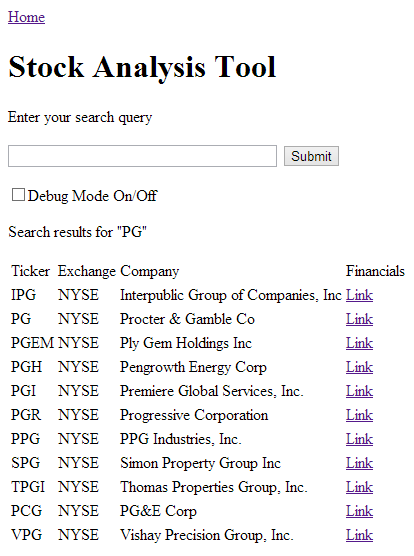
The search page allowed a ticker or company-name query and returned matching companies with links to their financial pages.
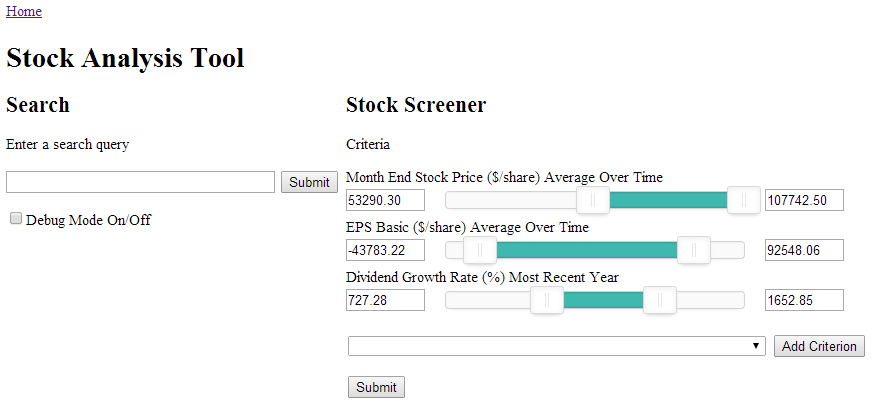
The screener made it possible to filter companies using ranges for selected financial metrics. Instead of opening companies one at a time, a user could set criteria and narrow the database to companies whose numbers fell within the chosen ranges.
The Technology Choices
The backend was written with Java servlets, while the front end used Grails.
I knew about Spring at the time, and a more conventional application might have used it more directly. But the purpose of this project was education, not selecting the most fashionable or efficient stack.
Writing the pieces myself was part of the exercise. I wanted to understand how a web application fits together:
- Collecting and cleaning external data.
- Modelling that data in a database.
- Querying and calculating values on the server.
- Returning results to a web interface.
- Building pages that people could use to explore the data.